- 이 강좌는 초심자 특히 전혀 프로그래밍에 대한 경험이 없는 분들을 대상으로 합니다.
( This course is for beginners, especially those with no programming experience. )
| - 한국은행 API 를 이용하여 일정기간동안 월간 KOSPI 지수 데이타를 수집하는 샘플 ( A sample that collects monthly KOSPI index data for a certain period using the Bank of Korea API ) - 한국은행 API 사용법은 https://ecos.bok.or.kr/jsp/openapi/OpenApiController.jsp 를 통해서 확인할 수 있음. |
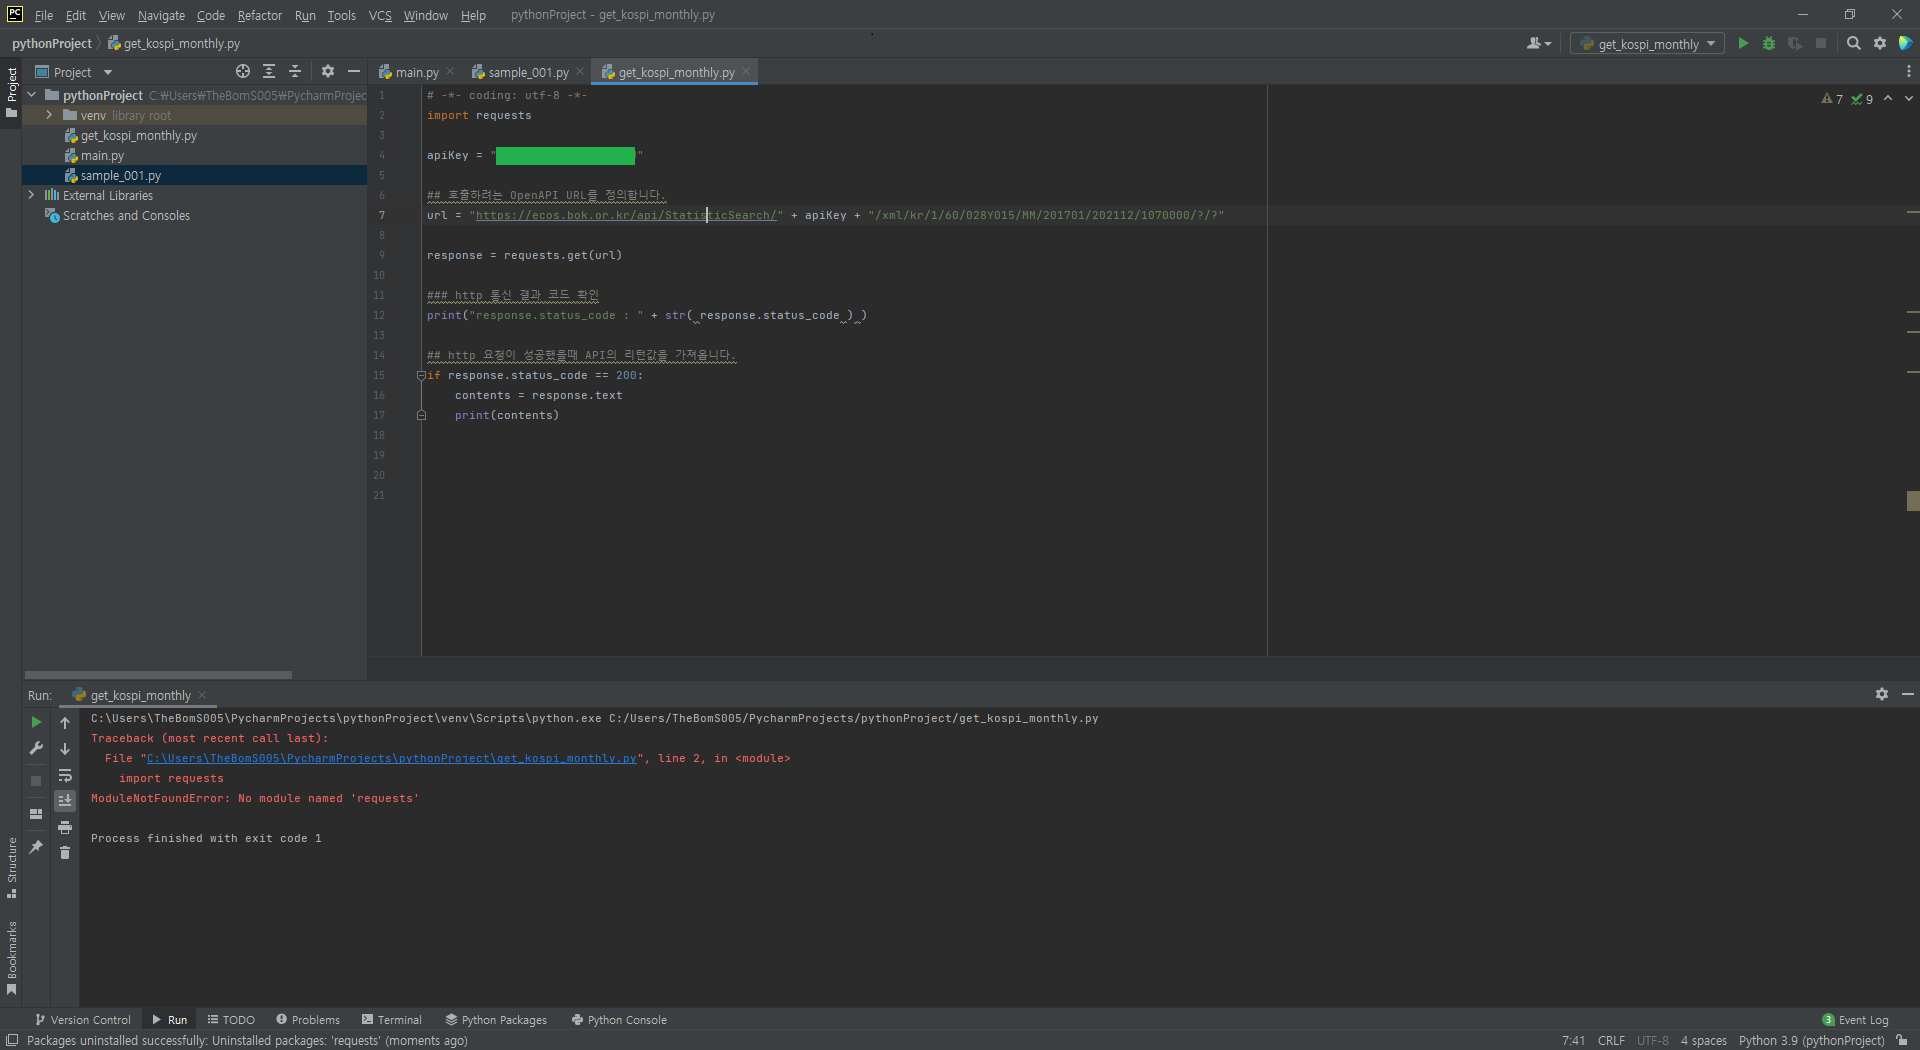
# -*- coding: utf-8 -*-
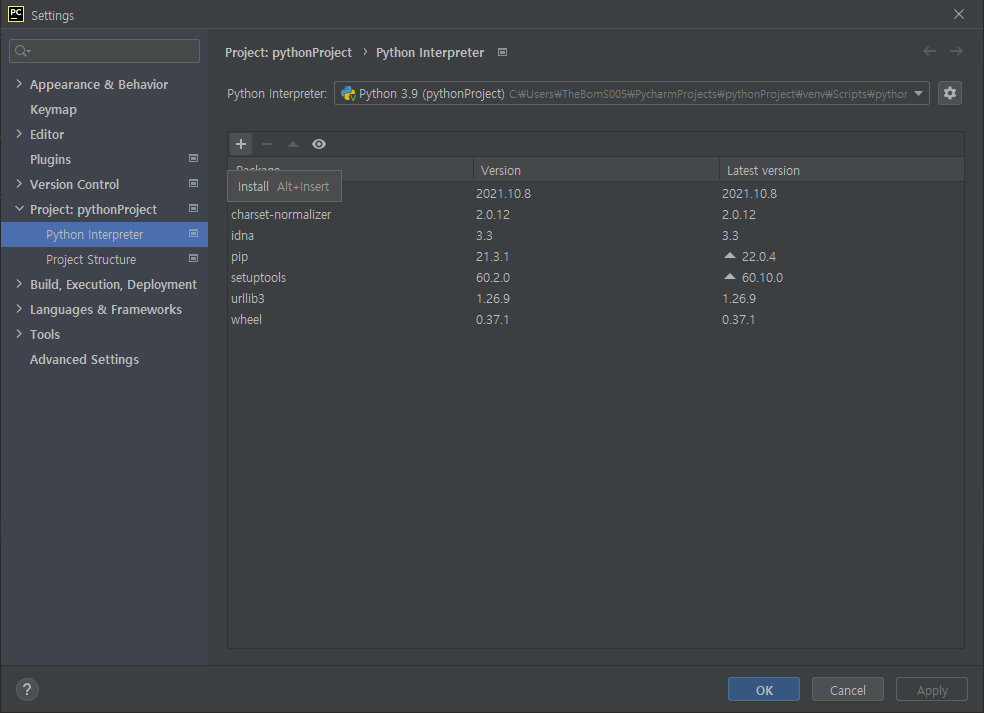
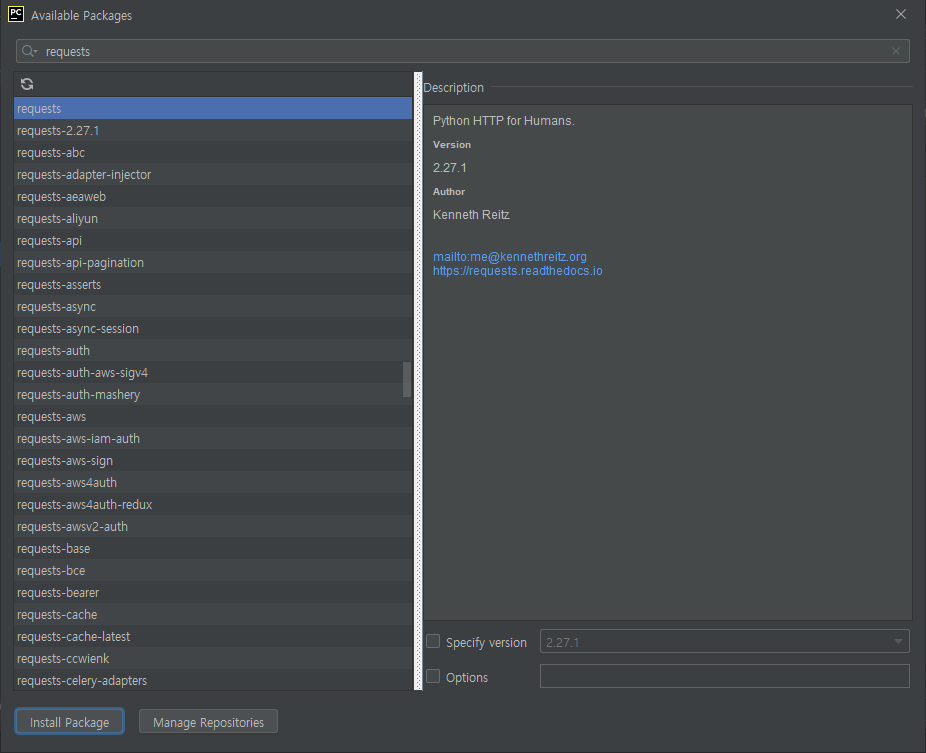
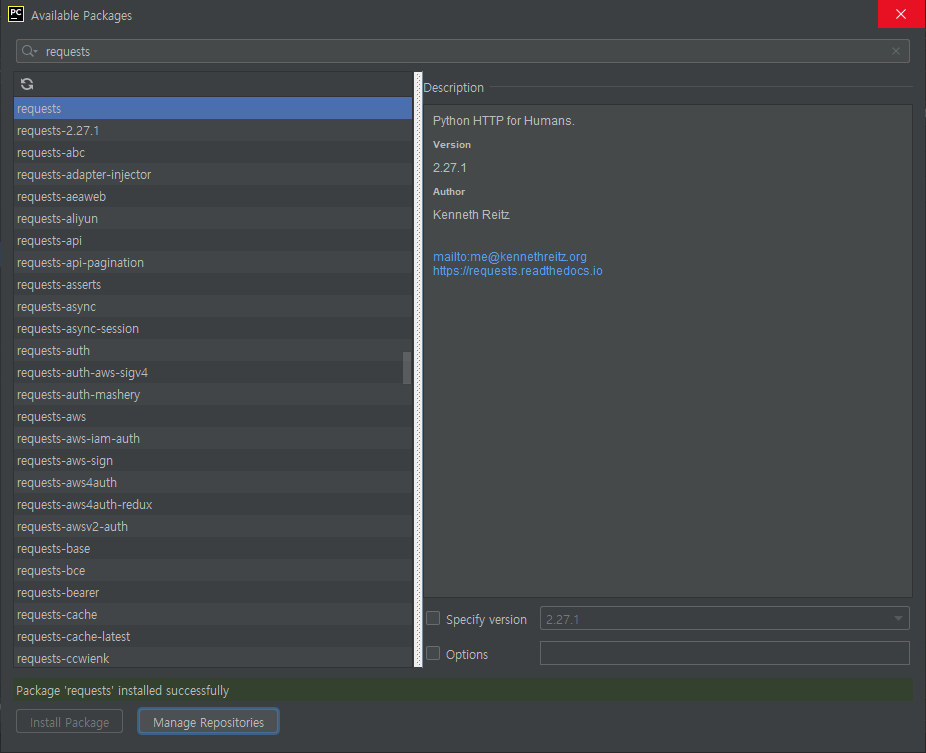
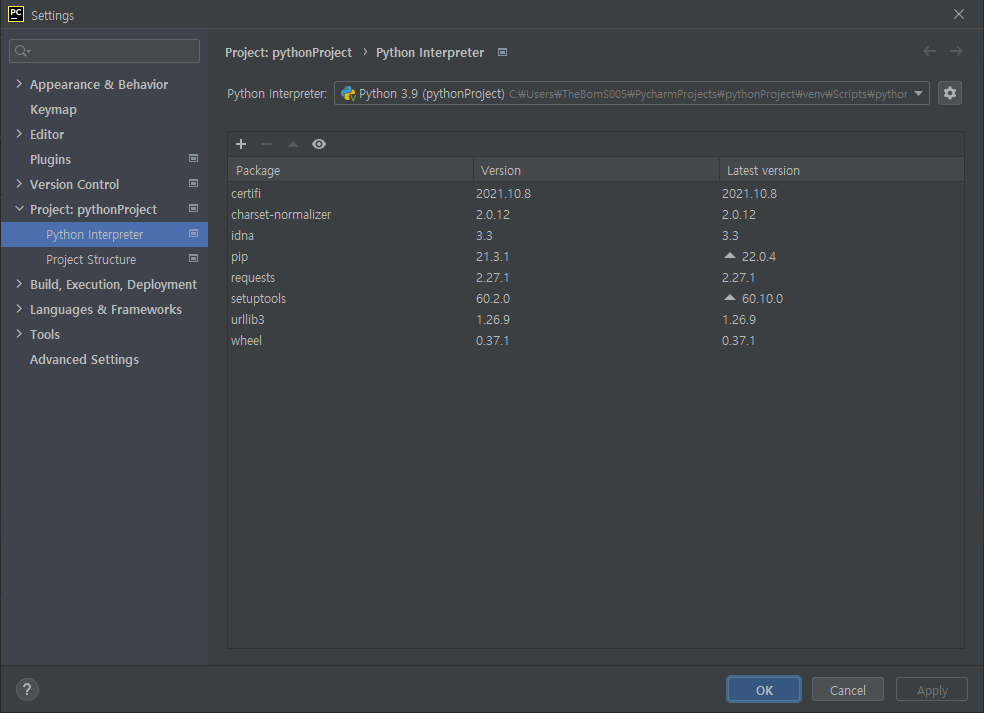
import requests
import xml.etree.ElementTree as ET
import matplotlib
import matplotlib.font_manager as fm
import matplotlib.pyplot as plt
from pprint import pprint
apiKey = "----------------------------"
## 호출하려는 OpenAPI URL를 정의합니다.
url = "https://ecos.bok.or.kr/api/StatisticSearch/" + apiKey + "/xml/kr/1/60/028Y015/MM/201701/202112/1070000/?/?"
response = requests.get(url)
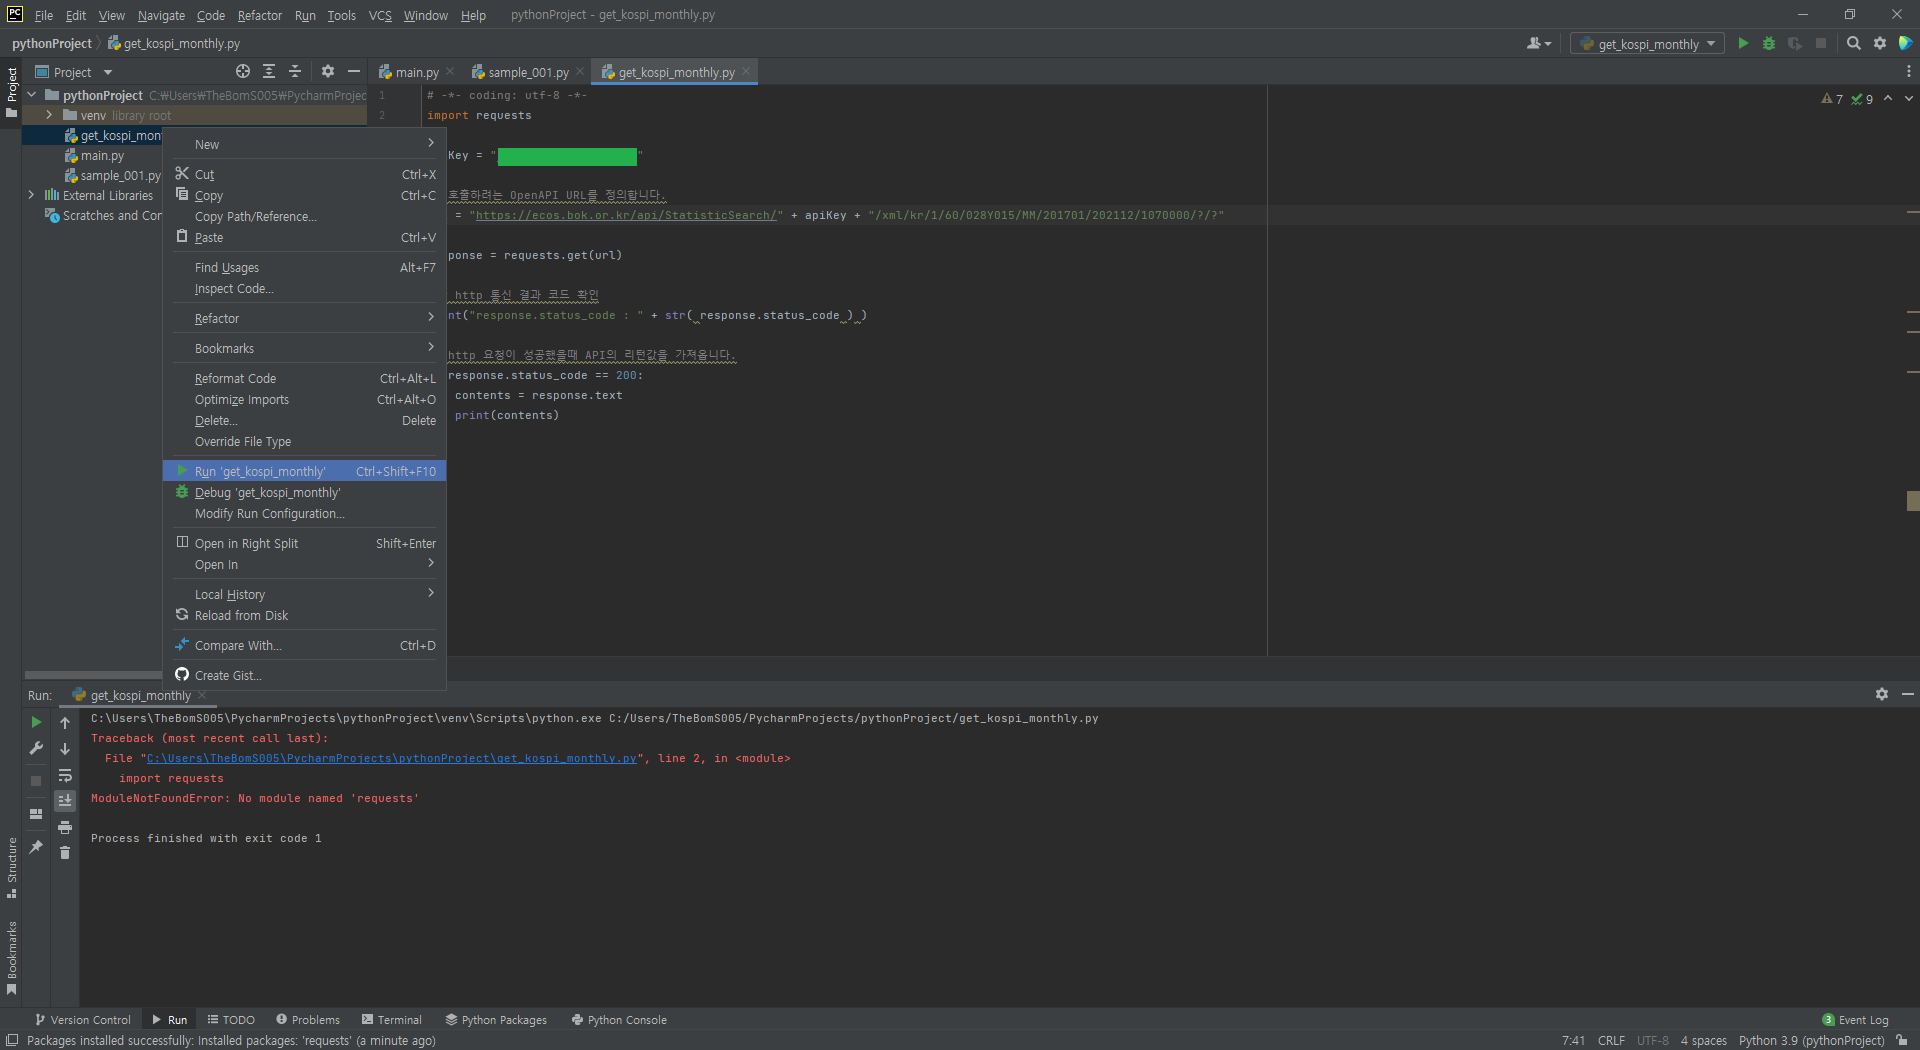
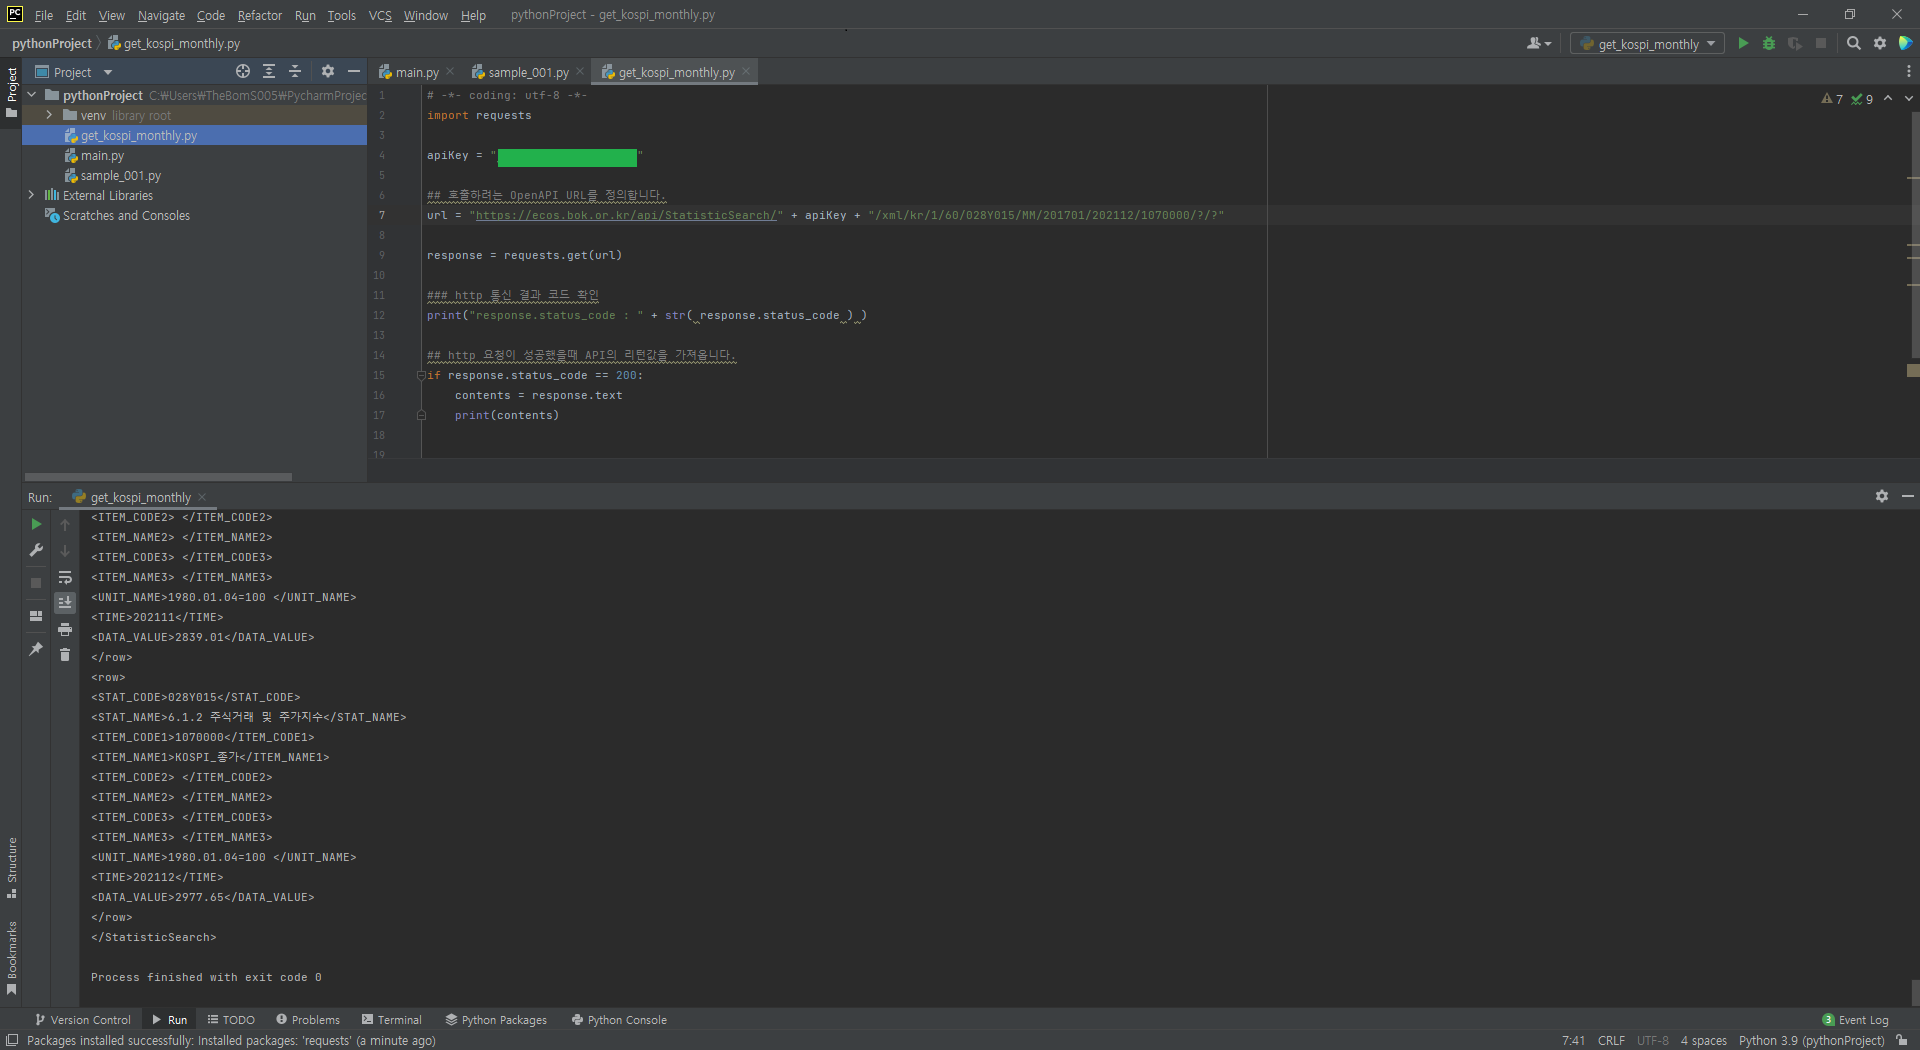
### http 통신 결과 코드 확인
print("response.status_code : " + str( response.status_code ) )
## http 요청이 성공했을때 API의 리턴값을 가져옵니다.
if response.status_code == 200:
contents = response.text
# print("@@@@@ API 수신 문자열(XML) @@@@@")
# pprint(str(contents))
ecosRoot = ET.fromstring(contents)
# print(str(len(ecosRoot)))
list_total_count = ecosRoot.find('./list_total_count')
print("list_total_count : " + str(list_total_count.text))
graph_data_month = [] # 빈 리스트 생성
graph_data_value = [] # 빈 리스트 생성
print("@@@@@ 2021-01 ~ 2021-12 월별 KOSPI 종가 평균 @@@@@")
# 반복문 - row tag 에 대하여 순회 한다. - Loop 다른
for row in ecosRoot.iter("row"):
# print("---------------------------------------------")
# print(str(obj_row.find('STAT_CODE').text))
# print(str(obj_row.find('STAT_NAME').text))
# print(str(obj_row.find('ITEM_NAME1').text))
# print(str(obj_row.find('TIME').text))
# print(str(obj_row.find('DATA_VALUE').text))
# print(str(obj_row.find('UNIT_NAME').text))
temp1 = str(row.find('TIME').text) + ":" + str(row.find('DATA_VALUE').text)
# print(temp1)
# row.find('TIME').text[0, 4]
temp2 = str(row.find('TIME').text)
year = temp2[0:4]
temp2 = str(row.find('TIME').text)
month = temp2[4:6]
# print(temp2)
# print(year)
# print(month)
graph_data_month.append( year + "-" + month )
graph_data_value.append( float(row.find('DATA_VALUE').text))
'''
for i in range(1, int(list_total_count.text) + 1):
# print("@@@@@ ROW NUMBER [ " + str(i) + " ] @@@@@")
row = ecosRoot.find("./row["+str(i)+"]")
# print(str(row.find('STAT_CODE').text))
# print(str(row.find('STAT_NAME').text))
# print(str(row.find('ITEM_NAME1').text))
# print(str(row.find('TIME').text))
# print(str(row.find('DATA_VALUE').text))
# print(str(row.find('UNIT_NAME').text))
temp1 = str(row.find('TIME').text) + ":" + str(row.find('DATA_VALUE').text)
# print(temp1)
# row.find('TIME').text[0, 4]
temp2 = str(row.find('TIME').text)
year = temp2[0:4]
temp2 = str(row.find('TIME').text)
month = temp2[4:6]
# print(temp2)
# print(year)
# print(month)
# temp = temp + "-"
# temp = temp + str(row.find('TIME').text)[0:2]
#graph_data_month.append(temp[0:4])
graph_data_month.append( year + "-" + month )
graph_data_value.append( float(row.find('DATA_VALUE').text))
'''
print("KOSIP 지수 기준점 : 1980.01.04=100 ")
print( graph_data_value )
print( graph_data_month )
# 폰트 설정
font_location = '/Users/yuk-youngmin/Library/Fonts/NanumGothic.otf' # For Mac
#font_location = 'C:/Windows/Fonts/NanumGothic.ttf' # For Windows
fm.fontManager.addfont(font_location)
font_name = fm.FontProperties(fname=font_location).get_name()
matplotlib.rc('font', family=font_name)
# 가로 20, 세로 10인 액자를 만듬.
plt.figure(figsize=(20, 8))
plt.title("2021-01 ~ 2021-12 KOSPI 코스피")
plt.xlabel(" Year month ")
plt.xticks(rotation=45)
plt.ylabel(" value ")
plt.plot(graph_data_month, graph_data_value, marker="o")
plt.ylim([0, 3500])
plt.grid(True)
# ax = plt.subplot()
# ax.set_xticks(graph_data_month)
plt.show()'!!...Python' 카테고리의 다른 글
| [python]2016 ~ 2021 삼성전자 임직원 현황 정보 가져오기 (0) | 2022.04.26 |
|---|---|
| [python]2021년 삼성전자 임직원 현황 정보 가져오기 (0) | 2022.04.26 |
| [python]2022.01~2022.03 daily 삼성전자 주식가격 (0) | 2022.04.26 |
| [python]MicroSoft 에서 만든 Python 기초강좌 (0) | 2015.03.30 |
| [참고] 점프 투 파이썬 Endless-Edition (0) | 2015.03.24 |